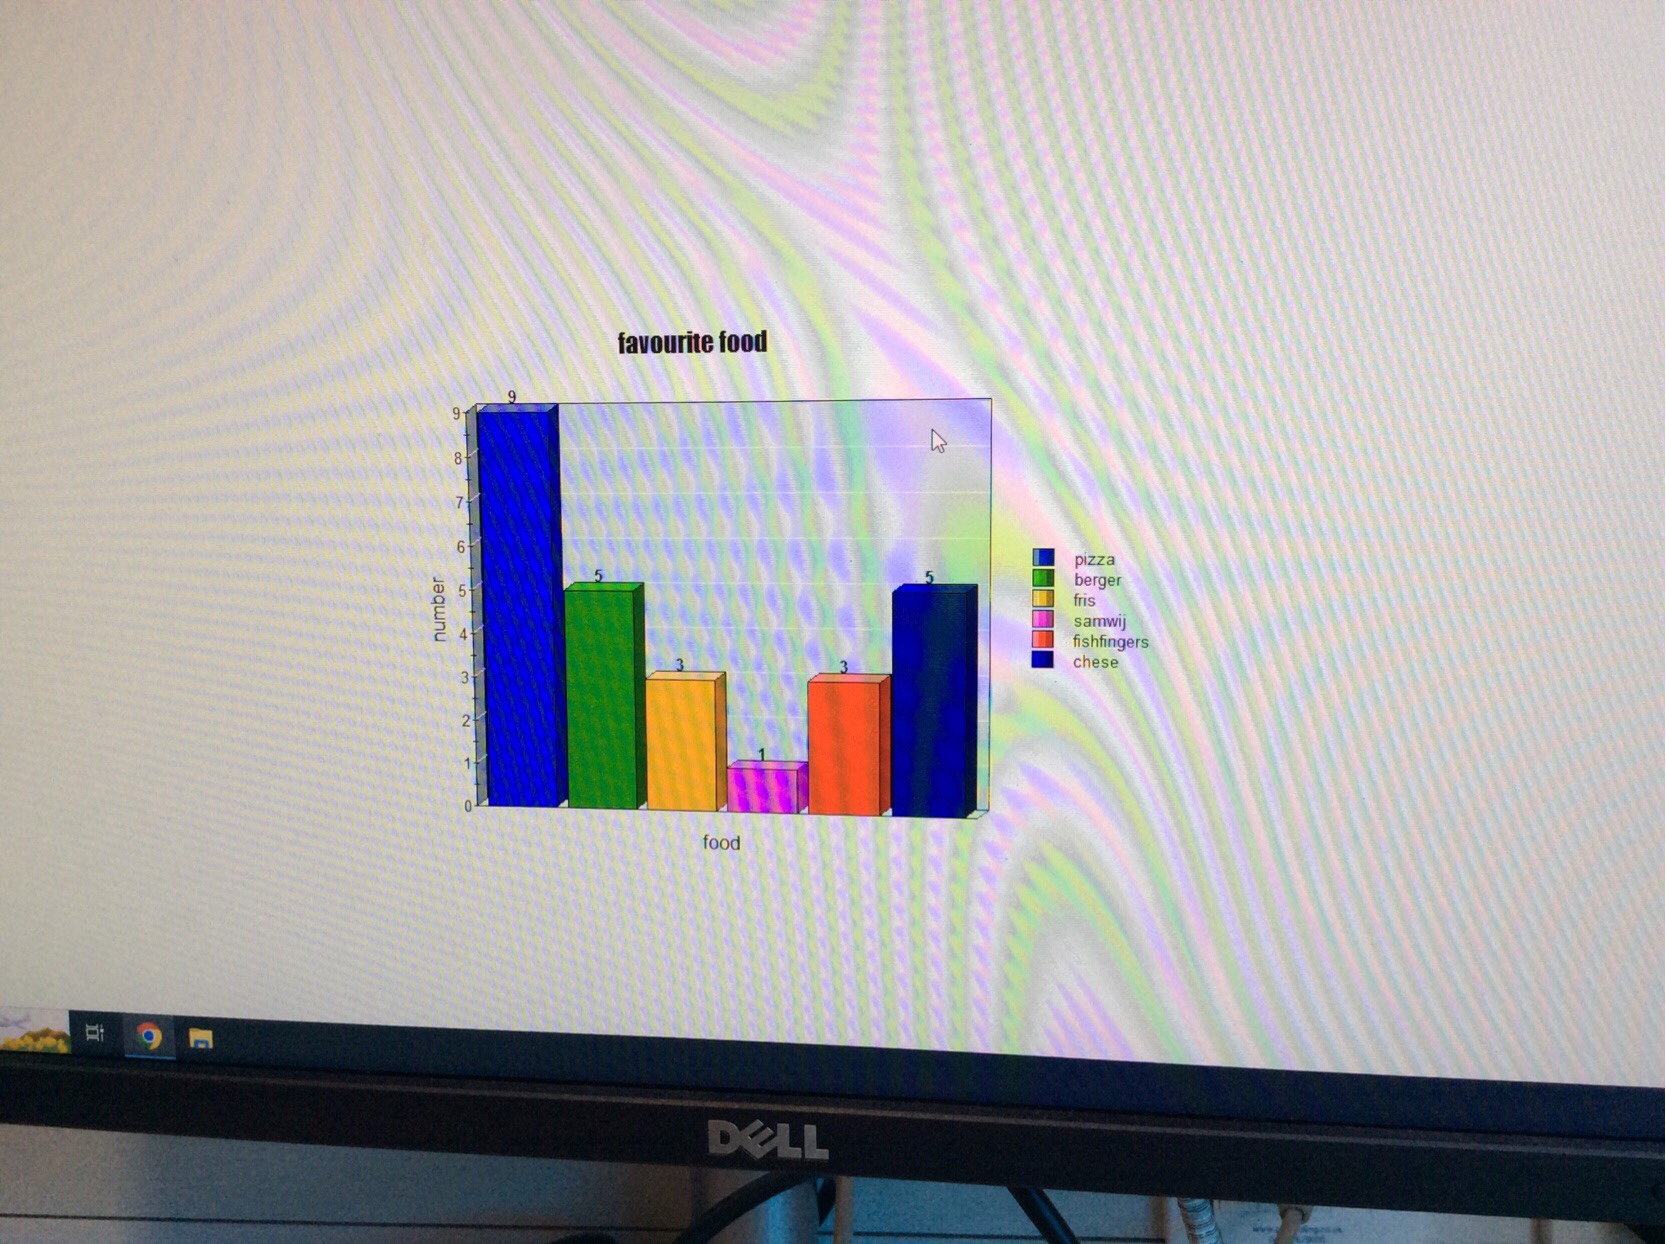
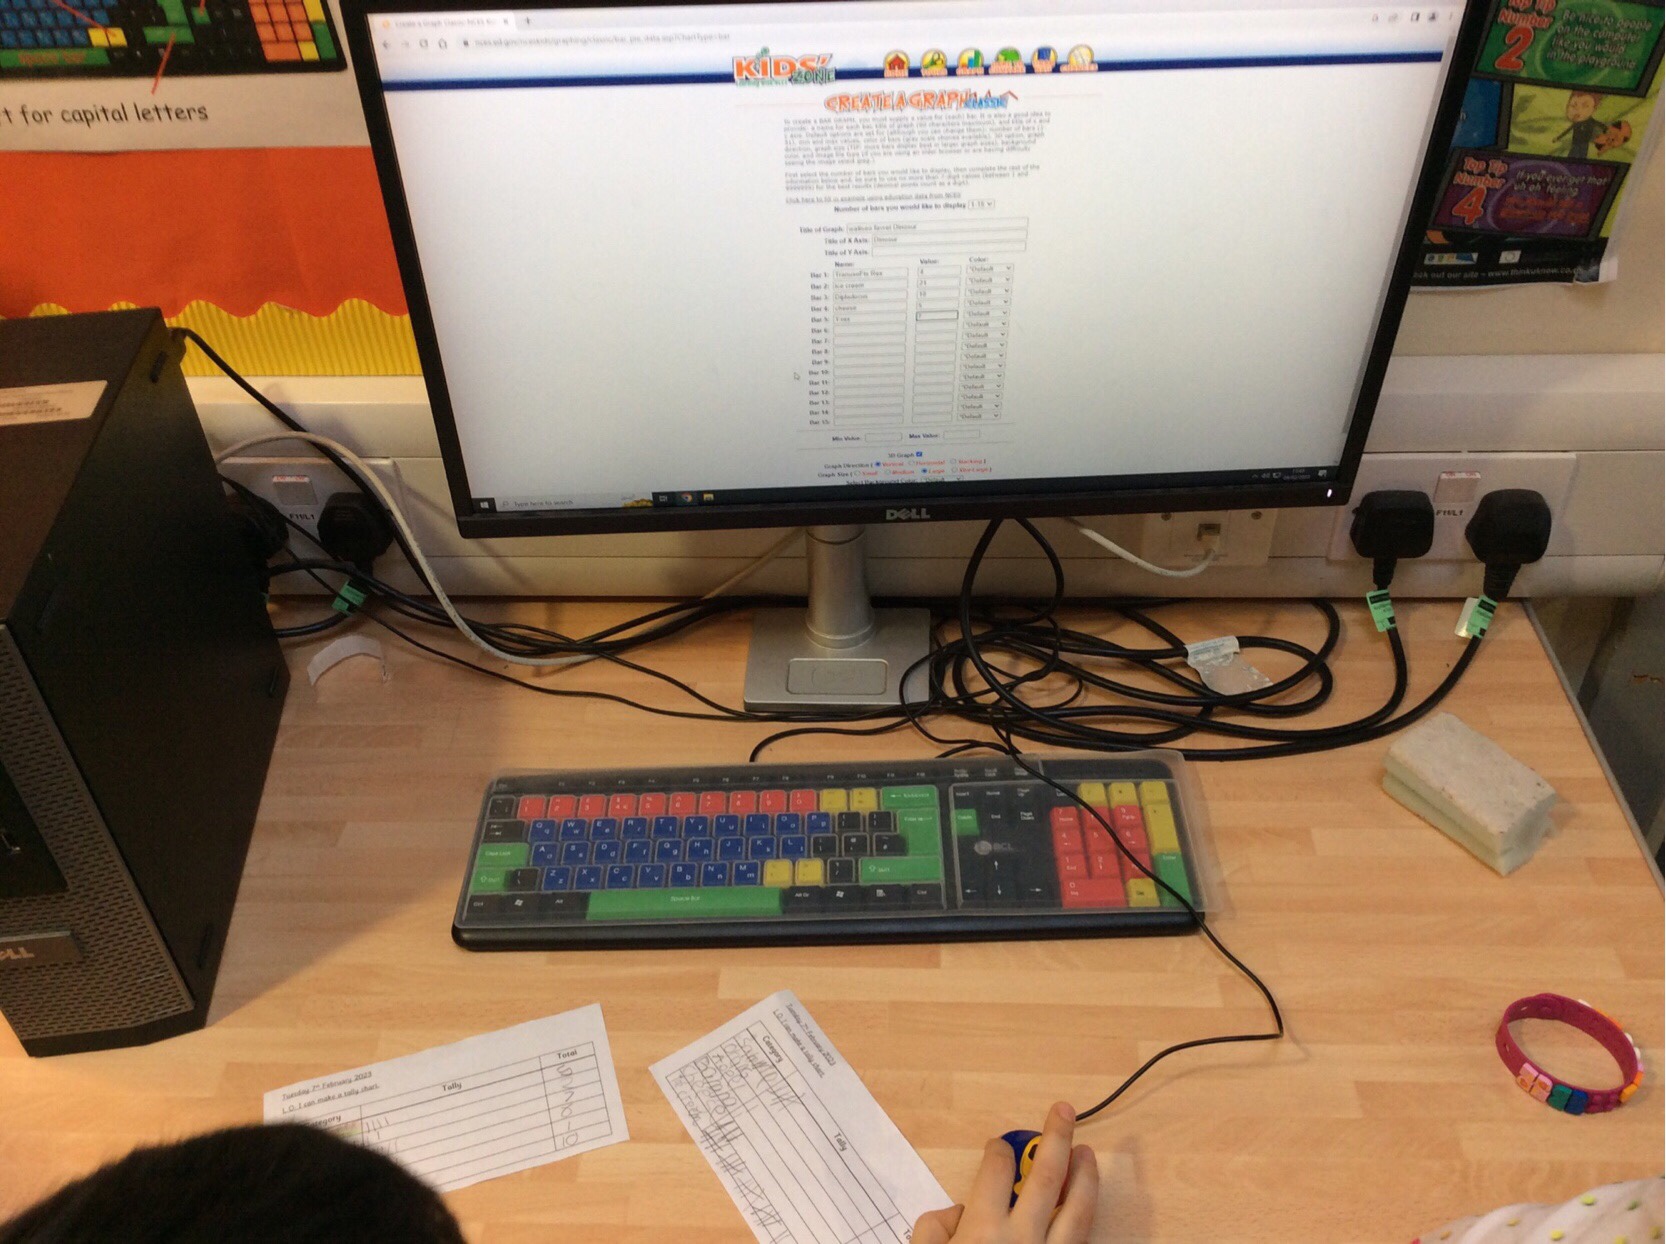
This week some of the Year 2 children used a graphing website to create a bar graph all about their favourite food!
“A bar graph is something where it shows how much stuff there is. Mine tells us about our favourite food. Pizza is the favourite because it got 9 votes.”